Forecasting 101

Understanding Pareto (ABC) Analysis

2021-08-19T13:55:34-04:00Categories: Forecasting Education|Tags: , , , |

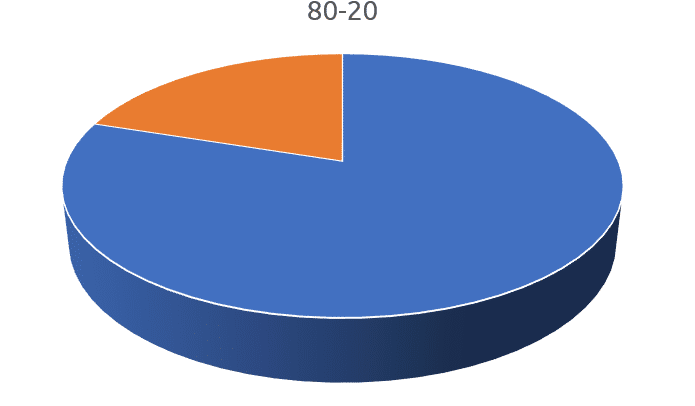
In the 19th century Dr. Wilfredo Pareto, an Italian economist, gave birth to the “80/20 rule” when he observed that 80% of the country’s wealth was held by 20% of the population. Today, many organizations find that the 80/20 rule (or a similar ratio) applies to their products—80% of their revenue comes from 20% of [...]

Box-Jenkins Forecasting

2021-08-19T13:54:23-04:00Categories: Forecasting Education|Tags: , , |

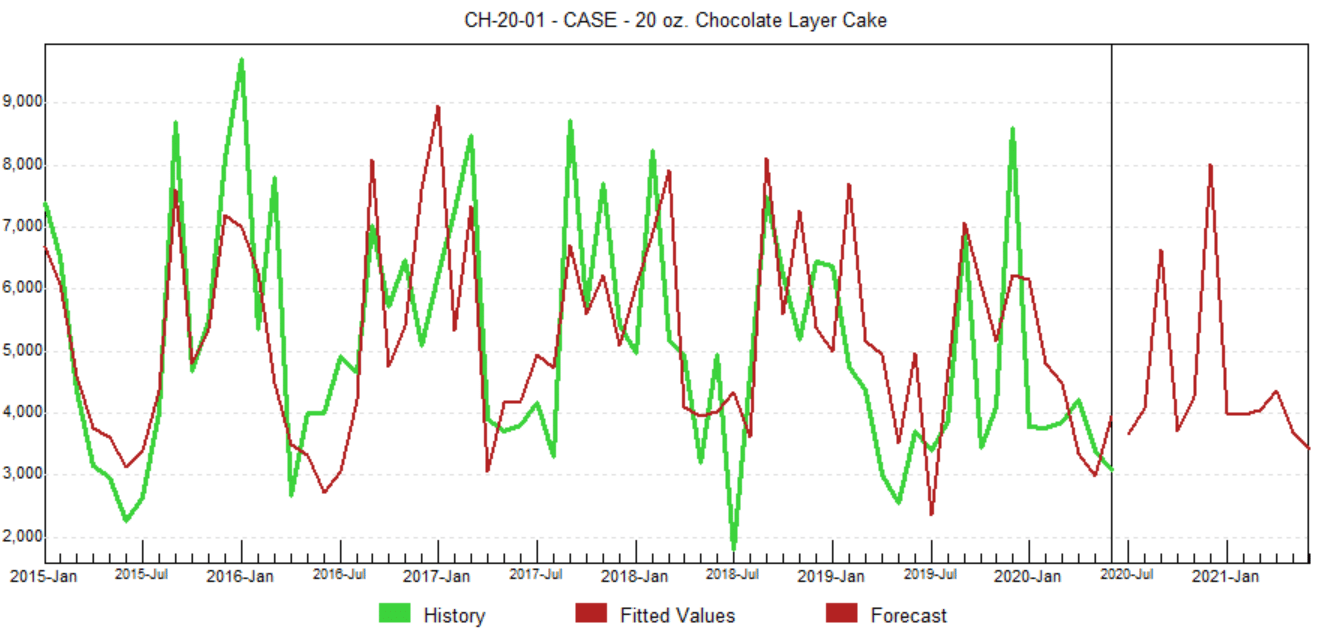
Box-Jenkins (ARIMA) is an important forecasting method that can yield highly accurate forecasts for certain types of data. In this installment of Forecasting 101 we’ll examine the pros and cons of Box-Jenkins modeling, provide a conceptual overview of how the technique works and discuss how best to apply it to business data. […]

How to Forecast Data Containing Outliers

2021-08-23T14:16:17-04:00Categories: Forecasting Education|Tags: , |

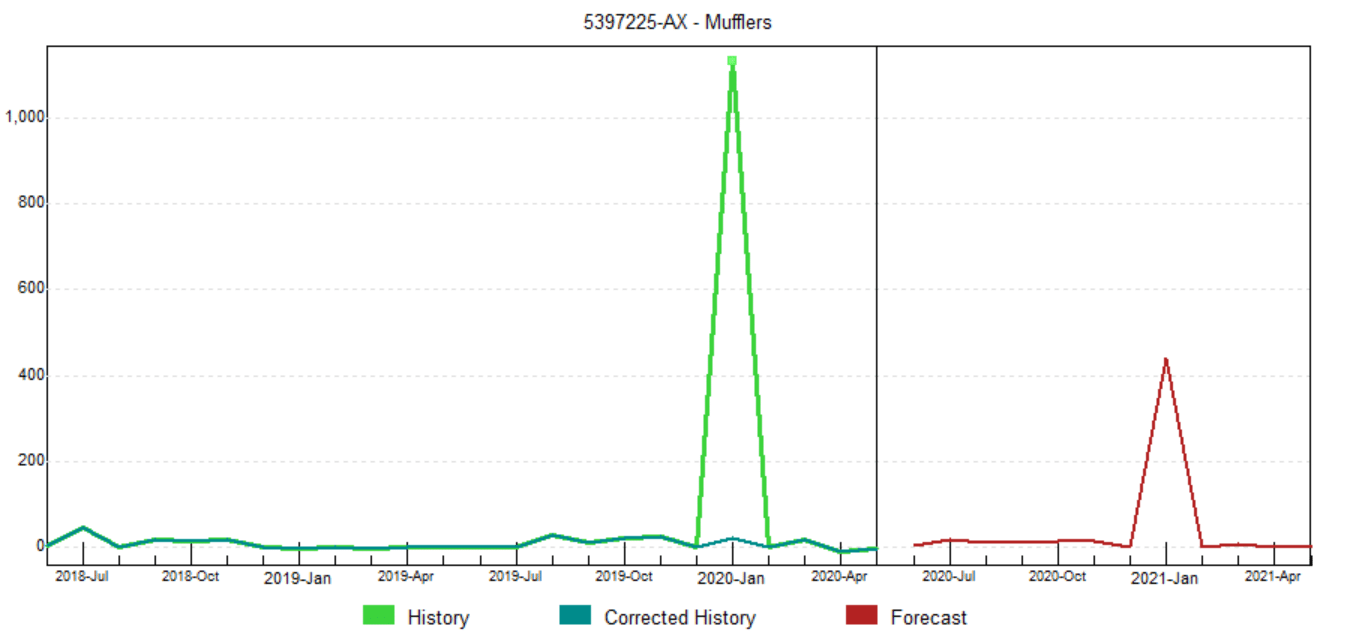
An outlier is a data point that falls outside of the expected range of the data (i.e., it is an unusually large or small data point). If you ignore outliers in your data, there is a danger that they can have a significant adverse impact on your forecasts. This article surveys three different approaches to [...]

Using Seasonal Simplification to Improve Forecasts

2023-08-24T18:05:07-04:00Categories: Forecasting Education|Tags: , |

Forecast Pro includes a forecasting approach called seasonal simplification. Seasonal simplification is an extension of exponential smoothing which “simplifies” the modeling of the seasonal pattern by reducing the number of indices used. In many cases the seasonally simplified model can substantially improve forecast accuracy. […]

Creating Accurate Forecasts When Your Demand History Includes Outliers

2021-08-23T17:34:39-04:00Categories: Forecasting Education|Tags: , , , |

Preparing forecasts using data that contain one or more unusually large or small demand periods can be challenging. Depending on your forecasting approach, these “outliers” can have a significant impact on your forecasts. This article surveys three different approaches to forecasting data containing unusual demand periods, discusses the pros and cons of each and recommends [...]

Managing Forecasts by Exception

2021-08-26T15:28:34-04:00Categories: Forecasting Education|Tags: , |

Human review of a statistically-generated forecast is an important step in the forecast process. Ideally, every statistical forecast should be inspected for plausibility. At times, the sheer volume of the forecasts being generated precludes exhaustive individual inspection. In these instances, exception reports are an effective tool to help you sift through the forecasts and focus [...]

Forecasting Products with Little or No Demand History

2021-08-23T17:19:32-04:00Categories: Forecasting Education|Tags: |

Demand history can provide forecasters with key insights into current trends, seasonal patterns and the relationships between demand and explanatory variables. Thus, creating forecasts when little or no demand history is available is particularly challenging. In this installment of Forecasting 101 we’ll examine different approaches to creating forecasts when little or no demand history is available. [...]

When is a Flat-line Appropriate and What Does it Tell You About Your Demand?

2021-08-23T17:55:51-04:00Categories: Forecasting Education|Tags: |

A forecasting technique which generates a forecast based solely on an item’s past demand history is referred to as a time series method. Typically, time series methods will capture structure in the history—such as current sales levels, trends and seasonal patterns—and extrapolate them forward. When the data are not trended and are not seasonal, a time [...]

Selecting Your Statistical Forecasting Level: How Low Should You Go?

2021-08-26T15:16:09-04:00Categories: Forecasting Education|Tags: , |

Many organizations need to generate forecasts at very detailed levels. For example, a consumer products company may need an SKU-by-customer forecast, a shoe manufacturer may need a shoe-by-size forecast, or an automobile manufacturer may need a parts-level forecast. One approach to generating low-level forecasts is to apply statistical forecasting methods directly to the lowest-level demand [...]

Go to Top