Human review of a statistically-generated forecast is an important step in the forecast process. Ideally, every statistical forecast should be inspected for plausibility. At times, the sheer volume of the forecasts being generated precludes exhaustive individual inspection. In these instances, exception reports are an effective tool to help you sift through the forecasts and focus on the items where human attention is most needed.
In this installment of Forecasting 101 we will survey different types of exception reports, explain how they work and illustrate how they are applied.
What is an Exception Report?
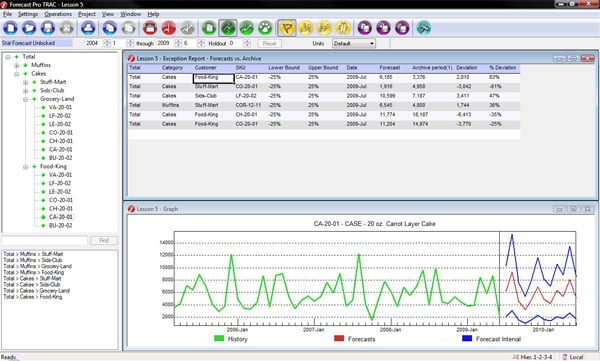
An exception report compares a value “A” to a value “B” and creates an entry for every item where the difference between “A” and “B” exceeds a defined threshold. The example above shows an exception report listing all items where the current forecast for the next month (“Forecast”) has changed by more than 25% compared to the last forecast generated for the same period ( “Archive period(1)”). The report lists the 6 cases where the 25% threshold was exceeded.
Reviewing exception reports is essentially a form of monitoring. In our example, the report allows us to immediately spot items for which our forecasts have changed significantly and thus human attention may be warranted.
Monitoring forecasts to spot potential problems prior to finalizing the numbers is a very common application of exception reporting. Typically the forecasts would be monitored against previously generated forecasts (as in the above example) or against historic values (e.g., against the last historic point or the same period last year).
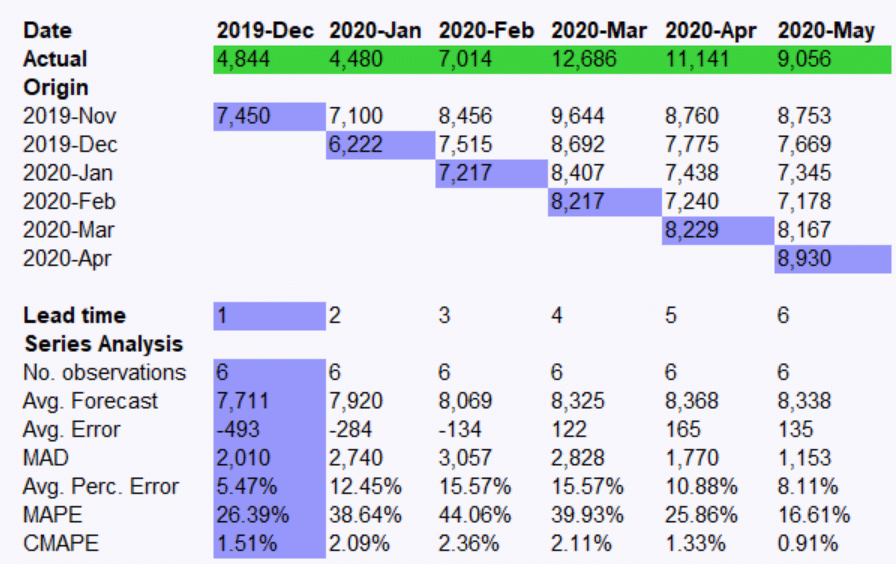
Another application of exception reporting is to monitor forecasts that you’ve generated in the past against what actually happened. This allows you to spot problem areas where changes in your forecasting approach might be considered.
Some forecasters monitor within-sample error statistics such as the MAPE and MAD. This type of exception reporting is often misused by individuals who assume that large within-sample errors indicate poor forecasting models—usually they don’t. More commonly, large within-sample errors reflect the scale and volatility of the data rather than the accuracy of the forecasting model. Highly volatile data sets always generate large within-sample errors because they are volatile—not because the forecasting model is doing a poor job. Similarly, high-volume series generate larger MADs (unit errors) than low-volume series because they are higher volume—not because the forecasting model is inferior. Thus, monitoring within-sample statistics can be useful to understand the scale and volatility in the data, but since it is not monitoring the actual forecasts, it is not very useful in terms of finding potentially poor forecasts where action may be needed.
How Do I Select the Thresholds?
An important consideration when running exception reports is setting proper values for the thresholds. Let’s consider our previous example, where we set the exception thresholds to flag any forecast that changed by more than 25%, generating 6 exceptions.
Clearly, if we had selected a lower threshold (say 10%) we would have generated more exceptions, and if we had selected a higher threshold (say 50%) we would have generated fewer exceptions. Thus, the thresholds control the sensitivity of the monitor (i.e., how many exceptions are detected) and by extension, the number of forecasts that will need to be manually reviewed.
When forecasters manually review the forecast for an item on an exception report they either decide that the forecast is not acceptable and change it, or they decide that the forecast is acceptable and leave it as is. Items that fall into the latter category are sometimes referred to as false positives (i.e., they were flagged as exceptions; however, no action was required).
Lowering the threshold values will generate more exceptions and a higher fraction of these exceptions will be false positives. There is a cost to lower thresholds—reviewing additional false positives requires time and resources and does not improve the final forecasts. On the other hand, there is also a benefit to lower thresholds—they can generate additional true positives where taking action improves forecast accuracy and saves money. Thus, the thresholds need to be set to values that balance the cost of reviewing the false positives with the cost of missing true positives. This is usually accomplished by some up-front experimentation to understand the relationship between the size of the thresholds and the number of false positives generated.
It should also be noted, that thresholds should rarely be “one-size-fits-all”. High-value items warrant lower thresholds (and thus more weeding through false positives) than low-value items, by virtue of the higher cost of missing the true positives. A good practice is to categorize your items based on their importance and vary the thresholds for your different categories accordingly.
If you are interested in hands-on training, Forecast Pro product training workshops are available both via the Web and on-site.
For a deeper understanding of various forecasting methodologies and how they are implemented in Forecast Pro, attend one of our comprehensive forecasting seminars.
About the author:
 Eric Stellwagen is the co-founder of Business Forecast Systems, Inc. and the co-author of the Forecast Pro software product line. With more than 27 years of expertise, he is widely recognized as a leader in the field of business forecasting. He has consulted extensively with many leading firms—including Coca-Cola, Procter & Gamble, Merck, Blue Cross Blue Shield, Nabisco, Owens-Corning and Verizon—to help them address their forecasting challenges. Eric has presented workshops for a variety of organizations including APICS, the International Institute of Forecasters (IIF), the Institute of Business Forecasting (IBF), the Institute for Operations Research and the Management Sciences (INFORMS), and the University of Tennessee. He is currently serving on the board of directors of the IIF and the practitioner advisory board of Foresight: The International Journal of Applied Forecasting.