A forecasting technique which generates a forecast based solely on an item’s past demand history is referred to as a time series method. Typically, time series methods will capture structure in the history—such as current sales levels, trends and seasonal patterns—and extrapolate them forward. When the data are not trended and are not seasonal, a time series method will often generate a flat-line forecast reflecting the current sales level. Because a flat line is often an implausible scenario for the future, delivering a flat-line forecast to management may require explaining the distinction between a scenario for the future and a statistical forecast of the future. This article explains this distinction and discusses when a flat-line forecast is and is not appropriate.
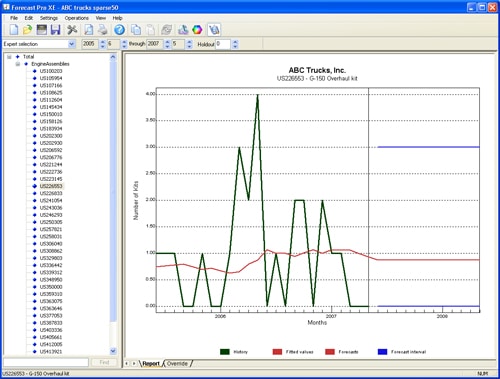
Figure 1
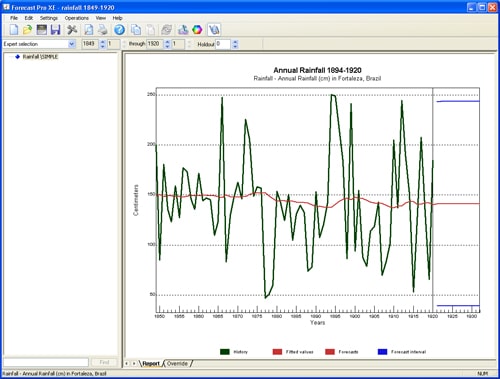
Figure 2
Consider the two data sets shown above. Figure 1 represents monthly demand for an expensive spare parts assembly needed to maintain commercial equipment. Notice that the historic demand consists of integers and has equaled either 0, 1, 2, 3 or 4 units in any given month. Figure 2 represents annual rainfall in a city in Brazil for the period 1849-1920. Notice that historically it has rained anywhere from 50 to 250 centimeters per year and the amount of rainfall can vary quite widely from year to year.
Neither data set is trended. Neither data set is seasonal. Thus their forecasts are not trended and are not seasonal—they are flat. This does not indicate that the future demand for the spare parts assembly or rainfall will be flat—these amounts will continue to fluctuate in the future—it just indicates that how these amounts will fluctuate is not predictable based solely on the historic data. The expected range of the fluctuations is shown by the confidence limits.
Let’s take a closer look at our spare parts assembly. The forecast is 0.9 units per month and the upper confidence limit is set to 97.5%. Notice that the forecast is not a possible scenario for the future—we will not sell 0.9 units per month for the next twelve months—in all likelihood we will continue to sell either 0, 1, 2, 3 or 4 units in any given month. The problem is that the timing and size of the future orders is not knowable from the past history. So what does our forecast tell us and how do we use it?
In the statistical sense, the forecast is the expected value for the future periods. It is the point at which (according to the model) it is equally likely that the actual value will fall above or below. If we are trying to estimate expected revenue for our spare parts assembly, this is exactly what we want. We can take our forecasts and multiply them by our average selling price to determine our expected revenues. If we want to know how many spare parts assemblies to keep in inventory we use our upper confidence limit.
Notice that even though our data is highly variable and our forecast is flat, the accuracy of the forecast and confidence limits still has a major impact on our revenue planning and inventory policies. Thus it is important to generate the most accurate forecast possible, even when the forecast is a flat line.
About the author:
 Eric Stellwagen is the co-founder of Business Forecast Systems, Inc. and the co-author of the Forecast Pro software product line. He has consulted widely in the area of practical business forecasting and regularly presents workshops on the subject. He has worked with many leading firms including Coca-Cola, Procter & Gamble, Merck, Blue Cross Blue Shield, Nabisco, Owens-Corning and Verizon. He has presented seminars and workshops under the aegis’s of many groups including the Institute for Professional Education, the American Production and Inventory Control Society, the University of Wisconsin, the Institute for Business Forecasting, the World Research Group, the International Institute of Research, the Electric Power Research Institute, the International Communications Forecasting Association and the International Institute of Forecasters. He is currently serving on the board of directors of the International Institute of Forecasters and on the practitioner advisory board of Foresight: The International Journal of Applied Forecasting.