Pareto analysis, also known as ABC classification, is a useful method for classifying forecast items according to their relative importance to the organization. Typically, important high-volume items are categorized as type “A”, medium-volume items are categorized as type “B” and slow-moving items are categorized as type “C”. Many organizations adopt different procedures for creating, reviewing and monitoring their forecasts based upon the codes.
In this installment of Forecasting 101, we explain what Pareto analysis is, examine the different approaches for assigning Pareto codes to your forecast items, and discuss how the classifications can be used to improve your forecasting process.
Why Assign Pareto Codes?
Pareto codes provide a framework to set different policies for your forecast items based upon their importance. For example, you may decide that forecasts for type A items are always reviewed, forecasts for type B items are only reviewed if an exception report indicates a potential problem and forecasts for type C items are never reviewed. There are a variety of parameters—such as targets for forecast accuracy, safety stock policies and thresholds for exception reports—that might be set based upon an item’s classification.
Pareto codes provide other benefits as well. The presence of a Pareto code on a report instantly conveys an item’s importance. When using forecasting software such as Forecast Pro, the ability to filter and sort by the Pareto codes allows you to optimize how you spend your time by concentrating on your “big hitters.”
How Are Pareto Codes Assigned?
Many organizations base Pareto codes on volume (typically either unit volume or dollars).
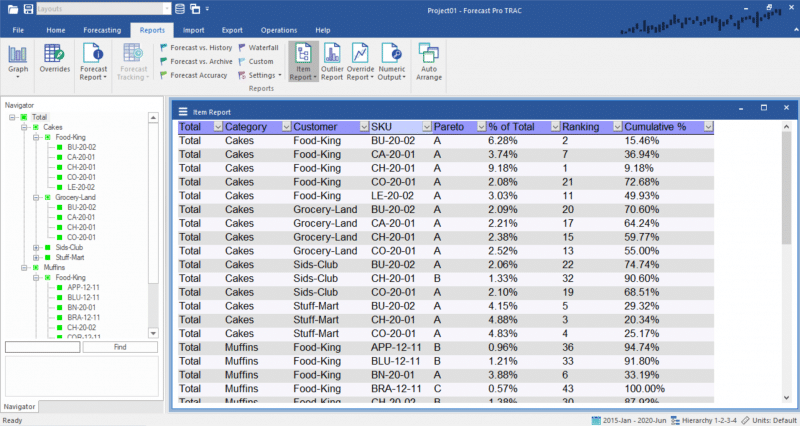
The screen shot above shows items ranked by volume. The % Total of field displays the percentage of total volume that the item represents. The Ranking field is self-explanatory.
There are different approaches to assigning Pareto codes based on volume. Forecast Pro supports three different ways—“volume (%)”, “series count (#)” and “series count (%)”. The first step for all three is to rank all items by volume.
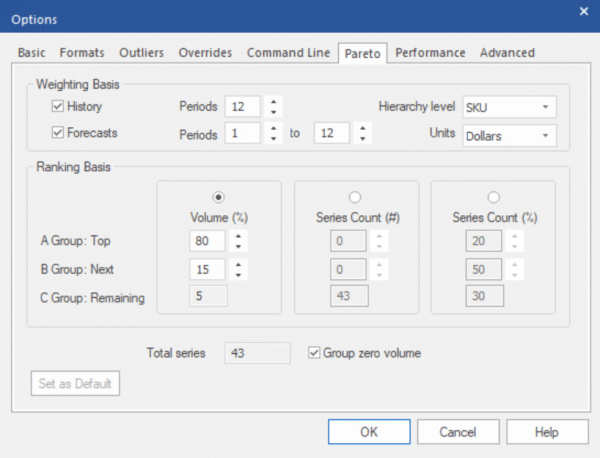
Volume (%) is the method truest to the 80/20 rule. It is based on the cumulative volume of each group. For example if you set type A to 80%, type B to 15% and type C to 5%, the top ranked items will sequentially be assigned to the A group until their cumulative volume equals or exceeds 80% of the total volume. The next highest ranked items will then sequentially be assigned into the B group until the cumulative volume of the A and B items equals or exceeds 95% (80% + 15%). The remaining items (5% or less of the cumulative volume) are then assigned type C.
Series Count (#) allows you to assign specific numbers of items to each group. For example, if you have 1,000 items and you set the A group to 100, the B group to 200 and the C group to 700—the 100 highest ranked items will be assigned to group A, the next highest 200 items will be assigned to group B and the remaining items will be assigned to group C.
Series Count (%) assigns the specified percent of the total number of items you have to each group. For example if A is set to 20%, B is set to 50% and C is set to 30%, the top ranked items will sequentially be assigned to the A group until the number of A group items equals 20% of the total number of items. The next highest ranked items will then sequentially be assigned to the B group until the number of B group items equals 50% of the total number of items. The remaining items (30% of the total number of items) are assigned type C.
An alternative to assigning Pareto codes based on volume is to devise a custom classification based on the value provided to the company. For example, you might choose to classify items based on profitability, strategic importance or another criterion.
Summary
Pareto analysis is a useful tool for organizing and prioritizing your forecast items and optimizing your forecast process. It enables you to avoid wasting valuable time and resources by focusing on your most important items.
About the author:
 Eric Stellwagen is the co-founder of Business Forecast Systems, Inc. and the co-author of the Forecast Pro software product line. With more than 29 years of expertise, he is widely recognized as a leader in the field of business forecasting. He has consulted extensively with many leading firms—including Coca-Cola, Procter & Gamble, Merck, Blue Cross Blue Shield, Nabisco, Owens-Corning and Verizon—to help them address their forecasting challenges. Eric has presented workshops for a variety of organizations including APICS, the International Institute of Forecasters (IIF), the Institute of Business Forecasting (IBF), the Institute for Operations Research and the Management Sciences (INFORMS), and the University of Tennessee. He is currently serving on the board of directors of the IIF and the practitioner advisory board of Foresight: The International Journal of Applied Forecasting.