The recording of our recent educational one-hour Webinar is now available for viewing on-demand
Learn about helpful tools that make it easier for you to focus on the specific items that need your attention:
- Outlier detection for highlighting anomalies in historic data.
- Exception reports for identifying problems in the forecasts.
- Item reports for quickly defining and reviewing subsets of your data.
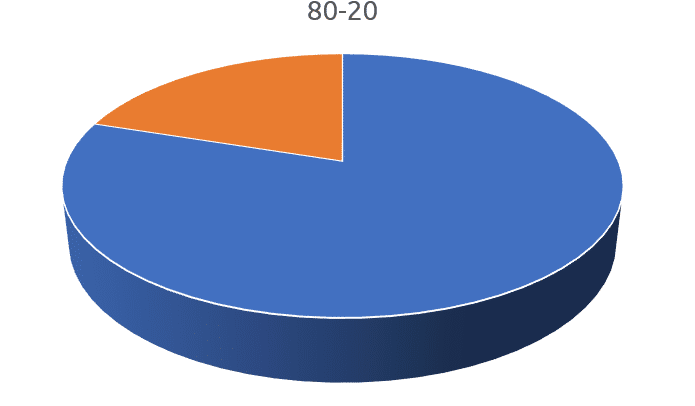
- Filtering & ABC Categorization (Pareto Analysis) for classifying items, allowing you to focus on the items that have the greatest impact on your bottom line.
You can register now for our next live Webinar Integrating Statistical Forecasts with Other Input to Create a Demand Plan for S&OP


